A Look At Real Lead Generation Percentages and Pay Back

Confirming How Much Conversion Comes from a Typical White paper Download Offer
One of the most common methods of generating qualified B2B leads is a white paper download offer. Yet expectations of the actual conversion rate vary with the method of generating visitor traffic, average expected sale and ROI. Here’s one project that tested a blended email list for base conversion.
Question: How Much Can We Pay for Traffic and Still Be Profitable?
The effort was for an enterprise-grade SAAS (software as a service) offering that helped companies assess and maintain their product or service quality. The white paper detailed a method of actually measuring the cost of providing substandard quality and how some of these basic measures can be used to retain existing customers, promote additional purchases and increase customer satisfaction.
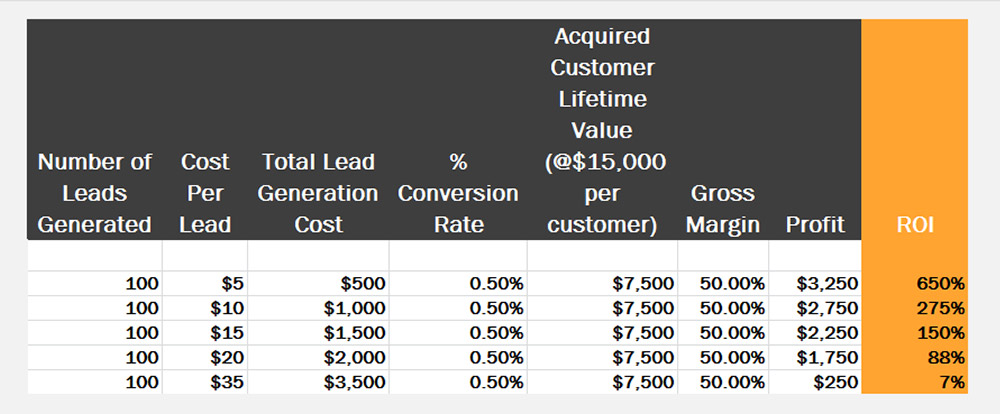
The actual software offer had a variety of modules that ranged in price from a few thousand to more than $25,000 per year, so a reasonably high purchase bar. Hence, lead quality and quantity were important, but before the client could measure those outputs, deciding how much to pay for traffic was a key element. The chart below showed some of the projected scenarios under which traffic generation did and did not make sense.
Cost Per Lead Had to Be Under $35 to Remain Profitable

Under the above projections, the cost per lead will greatly affect overall profitability of any lead generation effort. Therefore, the conversion target for general visitors to actual leads was critical. The above results assumed converting leads to actual sales in the 0.5% (Half a percent) range, resulting in about $7,500 in gross sales for every 100 leads generated.
What We Did
- Sending an email to two lists from a site that specialized in providing tools to corporations who want to improve their quality processes. Two lists were used: The first was a general email list composed of those who had requested a free tool series from the vendor. The second was a list of those who actually had purchased something from that company in the last three years.
- Creation of an extended-length landing page on that vendor’s site describing the product and offering links to a download page, hosted on the client’s site.
- Creation of a series of emails, tailored for specific industry segments, which were sent over the lists and which landed to the detailed page above (or in some cases, a direct link to the white paper download was provided)
- Setup of appropriate tracking from vendor-site through client site
In order to safeguard the profitability of the results, the list rental was negotiated on a performance basis, to include a per lead fee that was in the acceptable range based on the above. However, the vendor agreed to share gross traffic and conversion levels so an acceptable per visit fee could be determined feasible from this method of traffic generation.
The Results Of Email Lead Conversion Testing
As the chart below shows, a total of over 53,000 emails were sent resulting in a total of 6,939 “opens” representing some level of interest, similar to a visitor click through to a website. While the email open rate on the “previously purchased” list was higher (20% vs. 15%), confirming that customers with previous purchase patterns, are generally better responders – in this case even if the product was not one that they had typically purchased before. Because of tracking limitations, there was no breakout between previous purchase and general lists.
Caution: Even a List Of Previous Buyers Can Be Unprofitable

Even with blending a list that had previous purchasers, the cost per lead didn't meet the needed expectations. In this case, negotiating a "per lead" fee from the vendor was the best choice to ensure meeting cost per lead and profitability expectations.
The number of those who clicked through to the download form from the combined list was 6% (or about 330) and those who actually downloaded the white paper were 220, or about 66% of those who visited the download page. This resulted in an overall 3.0% (Three percent) conversion rate of “visitors” to lead.
- Find other “performance-based” traffic sources and monitor closure rates to determine lead quality
- Expand their use of “free” organic-based traffic
- Use aggressive per click fee bidding (i.e. low volume, low bids) or similar lower cost search traffic such as re-marketing which may have a chance of reaching the per click fee goal
