Q1 Marketing Job Hiring Surged 56%, But Pay Fell
Marketing hiring surged in the first quarter of 2026. Indeed job postings climbed 56% over Q4 2025, from roughly 2,700 listings to more than 4,220. But more openings didn’t translate to richer offers.
The average maximum salary slipped from $90,200 in Q4 to $86,900 in Q1 — a 3.6% decline — while average minimums fell from $70,000 to $66,100.
The data, covering nearly 7,000 scraped postings across all 50 states and several territories, tells a consistent story: companies entered 2026 hiring aggressively but budgeting cautiously.
Access the complete data here.
Key points
- New Year 2026 Hiring Surged with Average Salary Dip
- Remote and hybrid roles still post higher salaries vs. non-remote work
- Top States in Hiring Marketers Are Not the Top States for Marketer Pay
- 19% of Postings Do Not List Maximum Salary
- New York City, Los Angeles, and Chicago are largest identifiable city markets
- Several common job titles had more listings in Q1 2026, but many did so with weaker average pay.
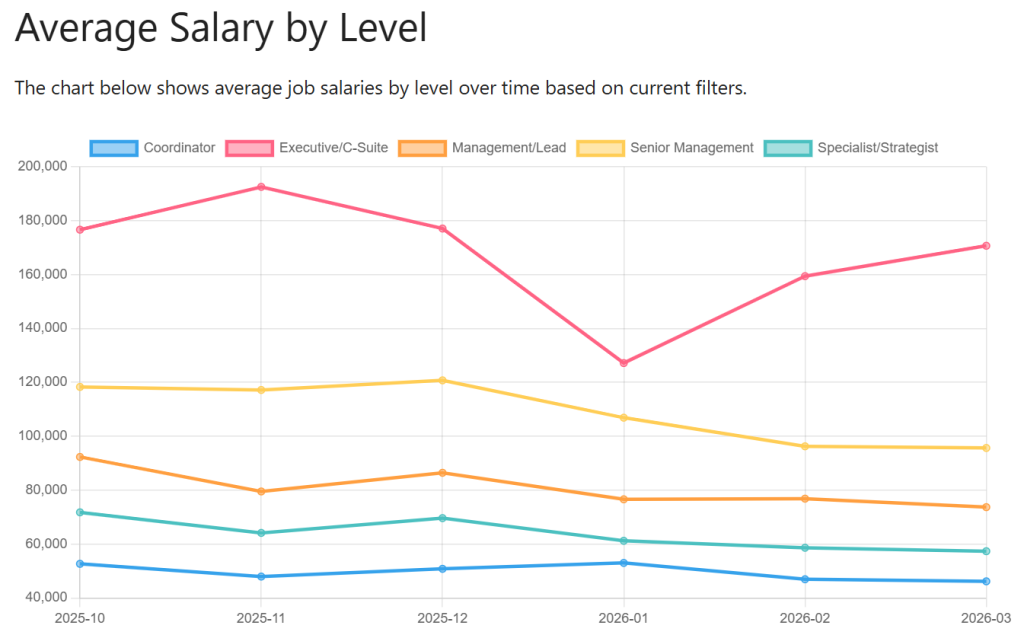
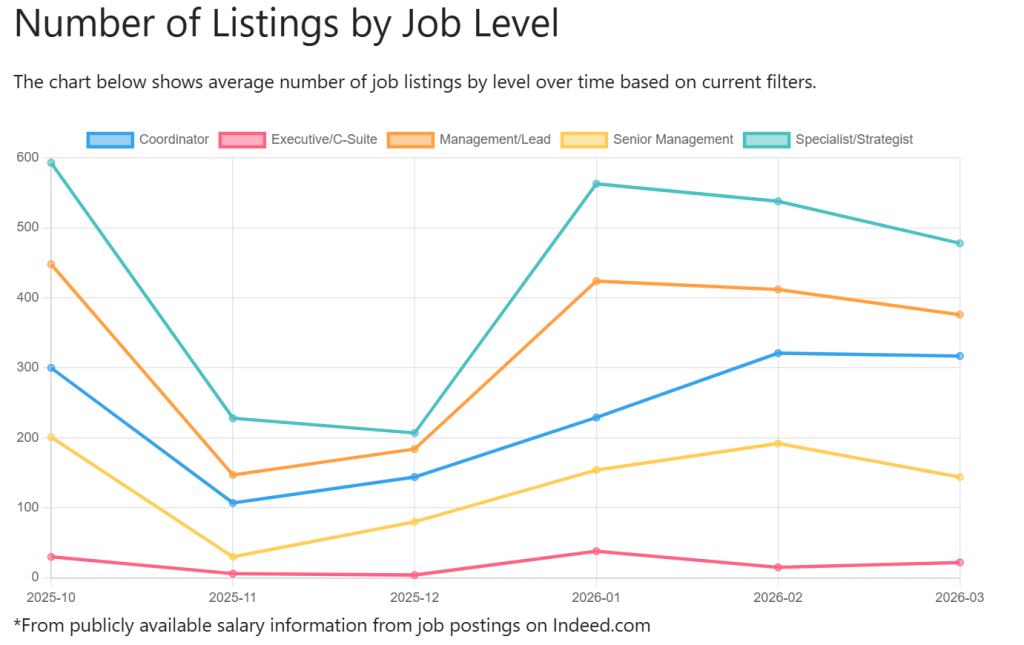
New Year 2026 Hiring Surged with Average Salary Dip
Q1 2026 brought 56% more postings than Q4 2025, from ~2,700 listings in Q4 2025 to ~4,220 listings in Q1 2026. However, average salaries dropped 3.6%, with an average minimum salary of $70k and maximum salary of $90.2k in Q4 2025 to $66k and $86.9k in Q1 2026, respectively.
The salary dip wasn’t uniform:
- C-Suite roles, the most senior job category, dropped the most, from $198.5K average max salary in Q4 to $176K in Q1 (−11.3%).
- Coordinator roles, the lowest/least senior job category, saw a salary rise between quarters, from $57.6K to $62.7K (+8.8%).
- Average maximum salary fell between quarters for Senior Management, Management/Lead, and Specialist/Strategist roles.
- This could suggest organizations prioritized filling junior pipelines in Q1 while C-Suite recruiting tightened.
- The same salary trends held for average minimum salaries among all five job levels. Only Coordinator positions saw an increase in minimum pay (+4.4%).
- Other job levels saw minimum pay declines from -6.4% for Specialist/Strategist roles to -17% for Executive/C-Suite positions (Management/Lead and Senior Management positions had average minimum pay declines of -7% and -9%, respectively).
Average salaries by job level, Q4 2025 to Q1 2026
| Job Level | Q4 2025 Avg Max | Q1 2026 Avg Max | Max % Change | Q4 2025 Avg Min | Q1 2026 Avg Min | Min % Change |
| Executive / C-Suite | $198,540 | $176,076 | -11.3% | $159,598 | $132,525 | -17.0% |
| Senior Management | $133,930 | $124,845 | -6.8% | $105,452 | $95,812 | -9.0% |
| Management/Lead | $101,335 | $93,568 | -7.7% | $78,359 | $72,886 | -7.0% |
| Specialist / Strategist | $81,057 | $76,856 | -5.2% | $61,592 | $57,646 | -6.4% |
| Coordinator | $57,647 | $62,741 | +8.8% | $47,398 | $49,499 | +4.4% |
Remote and hybrid roles still post higher salaries vs. non-remote work
About 80% of Q1 2026 job listings do not specify a work arrangement. Among postings that do, Hybrid roles represent the largest flexible-work category at 727 listings, or 17.2% of all Q1 2026 postings. Fully remote roles account for 65 listings, or 1.5%, and another 48 listings, or 1.1%, are classified as Remote Restricted (a remote role limited by geography, state, or similar constraints).
In Q1 2026:
- Remote Restricted roles posted the highest salary ceilings in Q1 2026, with an average maximum salary of about $101,209, compared to about $84,828 for roles with no stated arrangement, a gap of ~19%.
- Fully remote roles also showed a clear salary premium, with an average maximum salary of about $105,038, or about 24% higher than Unspecified roles.
- Hybrid jobs posted an average maximum salary of about $93,546, which is about 10% higher than Unspecified roles.
- The same pattern appears on the minimum-salary side, though the gap is somewhat smaller. Remote roles averaged about $78,028 in minimum salary, Remote Restricted roles averaged about $73,480, and Hybrid roles averaged about $71,517, compared to $64,593 for Unspecified jobs.
- Overall, the Q1 2026 data suggests that when employers explicitly offered some form of flexible work, those positions tended to pay more than postings that did not identify a work arrangement.
| Work Arrangement | Listings | % of Listings | Average min salary | Average max salary | Median min | Median max |
| Remote Restricted | 48 | 1.1% | $73,480 | $101,209 | $69,320 | $93,600 |
| Remote | 65 | 1.5% | $78,028 | $105,038 | $72,800 | $90,000 |
| Hybrid | 727 | 17.2% | $71,517 | $93,546 | $65,000 | $85,000 |
| Unspecified | 3,383 | 80.1% | $64,593 | $84,828 | $55,000 | $72,800 |
Top States in Hiring Marketers Are Not the Top States for Marketer Pay
In practical terms, the Q1 2026 data suggests that the biggest marketing job markets were not necessarily the best-paying ones, and some smaller or second-tier volume states delivered a much stronger salary profile than their posting count alone would imply.
California led in job listings in Q1 2026 with 538 postings, followed by New York at 335 and Florida at 311. However, New Jersey, only seventh in listing count at 143 postings, leads the top-10 group in average maximum salary at $111,531 and also posts the highest average minimum salary at $80,108. New York is next at $103,509 average maximum salary, while California, despite dominating on volume, comes in lower at $93,328.
Other Q1 2026 findings:
- The highest-volume Sun Belt states lag the top Northeast markets. Florida’s average maximum salary is $79,054 and Texas sits even lower at $75,970, compared with $103,509 in New York and $111,531 in New Jersey.
- Pennsylvania and Ohio also sit closer to the Sun Belt pay range than to the top Northeast tier.
- Among the other top-10 states, Illinois ranked fifth in volume with 192 listings and posted an average maximum salary of $90,770, putting it ahead of Florida, Texas, Pennsylvania, and Ohio.
- Arizona and Minnesota also performed better on pay than their listing rank might suggest, with average maximum salaries of $93,080 and $89,784 respectively.
- Washington State, which had 99 Q1 2026 listings, had a stronger pay profile with an average minimum salary of $80,806 and an average maximum salary of $104,589. That places Washington above California and roughly in line with New York and Massachusetts on pay, despite having far fewer postings.
Top 10 US states by job listing, Q1 2026
| State | Listings | Avg minimum salary | Avg maximum salary |
| California | 538 | $72,283 | $93,328 |
| New York | 335 | $76,226 | $103,509 |
| Florida | 311 | $59,225 | $79,054 |
| Texas | 254 | $59,382 | $75,970 |
| Illinois | 192 | $69,794 | $90,770 |
| Pennsylvania | 145 | $61,263 | $79,586 |
| New Jersey | 143 | $80,108 | $111,531 |
| Ohio | 130 | $60,334 | $78,416 |
| Arizona | 116 | $68,537 | $93,080 |
| Minnesota | 114 | $68,191 | $89,784 |
19% of Postings Do Not List Maximum Salary
In Q1 2026, employers were far more likely to disclose the salary floor than the ceiling. 813 of 4,223 listings, or 19% of listings, did not include a maximum salary while only 27 listings, or about 0.6%, were missing a minimum salary.
- For job seekers, a missing max may signal that the real offer is higher than what’s printed. For researchers, it means the true top end of the market is underrepresented in this data.
- Missing max salaries were most common in the middle of the market. Specialist/Strategist roles accounted for 326 of the 813 postings without a listed maximum salary, followed by Coordinator roles at 213 and Management/Lead roles at 184.
- On a rate basis, Coordinator postings, the lowest job level, were the most likely to omit a maximum salary, with about 24.6% of those listings missing one, compared with 20.6% for Specialist/Strategist roles and 15.2% for Management/Lead roles.
- Executive/C-Suite roles were the least likely to omit a maximum, though the category is much smaller overall.
New York City, Los Angeles, and Chicago are largest identifiable city markets
In Q1 2026, New York City led in job listings with 112 posted jobs, followed by Los Angeles at 58 and Chicago at 45.
- Seattle stood out as the strongest pay market in the group, with an average minimum salary of $97,017 and an average maximum salary of $124,466.
- New York combined scale and strong pay, yet Seattle, Chicago, and DC were strong salary markets despite far fewer job listings than NYC and LA.
- Miami, Houston, Austin, and Dallas were more middle- or lower-tier pay markets.
- High-volume markets like Los Angeles and Houston posted much lower average maximum salaries, around $85,206 and $85,367 respectively, while Miami came in lower still at about $81,750.
Top 10 US cities by job listing, Q1 2026
| City | Listings | Avg minimum salary | Avg maximum salary |
| New York, NY | 112 | $88,542 | $123,265 |
| Los Angeles, CA | 58 | $70,290 | $85,206 |
| Chicago, IL | 45 | $83,187 | $109,126 |
| Phoenix, AZ | 38 | $79,206 | $104,731 |
| Washington, DC | 36 | $84,276 | $107,612 |
| Miami, FL | 34 | $58,892 | $81,750 |
| Houston, TX | 32 | $68,918 | $85,367 |
| Austin, TX | 31 | $65,924 | $77,516 |
| Dallas, TX | 30 | $64,644 | $84,885 |
| Seattle, WA | 29 | $97,017 | $124,466 |
Several common job titles had more listings in Q1 2026, but many did so with weaker average pay.
Q1 2026 listings for the most common job titles became more concentrated around mainstream manager, coordinator, specialist, and digital-manager titles:
- Director-level and digital-manager titles gained prominence, while representative, communications-specialist, and some social-specific titles became less central to the top of the market.
- Marketing Manager and Marketing Coordinator roles remained the most common title in both quarters.
- Digital Marketing Manager was the fifth-most common job title in Q1 2026 despite not appearing in the top 10 in Q4 2025 (with only 11 listings). In Q1 2026, there were 45 listings.
- Some titles lost relative standing even if they still grew or held steady in raw volume. Marketing Representative was sixth in Q4 2025 but dropped out of the top 10 in Q1 2026. Communications Specialists also fell out of the top tier.
Even with more listings among common job titles, posted pay for Q1 2026 was generally weaker than Q4 2025 for common marketing titles, especially on the maximum-salary side. Most of these titles saw either outright declines or near-flat movement in average minimum pay, while upper salary ceilings often fell more sharply. Social Media Manager was the main exception.
- Marketing Manager, Marketing Coordinator, and Marketing Specialist all moved downward on both average minimum and average maximum pay.
- Job titles with the term “Digital” were mixed rather than uniformly weaker. Digital Marketing Specialist was almost flat on average minimum salary, rising 0.9%, but its average maximum still declined 3.9%. Digital Marketing Manager showed a stronger split: its average minimum salary fell 6.9%, but its average maximum salary actually increased slightly by 0.5%.
- Director of Marketing was one of the few titles to post an increase in average minimum salary, rising 2.2%, but its average maximum fell 5.4%.
- Marketing Director moved down on both measures, with a 3.6% drop in average minimum and a much steeper 9.4% drop in average maximum, which suggests some compression at the director level.
- Marketing Assistant was mostly flat on the minimum side, down only 0.4%, but its average maximum salary fell 12.7%, one of the steepest drops in the table.
- The clearest positive outlier was Social Media Manager, the only title here that improved on both measures, with average minimum salary rising 12.8% and average maximum salary rising 25.5%.
Most common job titles, Q1 2026
| Q1 2026 Rank | Job Title | Listings | Vs. Q4 2025 |
| 1 | Marketing Manager | 139 | 49 listings, Rank 1 |
| 2 | Marketing Coordinator | 113 | 42 listings, Rank 2 |
| 3 | Marketing Specialist | 77 | 21 listings, Rank 5 |
| 4 | Digital Marketing Specialist | 56 | 31 listings, Rank 3 |
| 5 | Digital Marketing Manager | 45 | 11 listings, Not in Top 10 |
| 6 | Director of Marketing | 35 | 25 listings, Rank 4 |
| 6 | Marketing Director | 35 | 12 listings, Rank 10 (Tie) |
| 8 | Marketing Assistant | 32 | 12 listings, Rank 10 (Tie) |
| 9 | Social Media and Marketing Manager | 30 | 11 listings, Not in Top 10 |
| 10 | Social Media Manager | 27 | 13 listings, Rank 9 |
Most common job titles with salaries, Q1 2026
| Job Title | Q4 Avg Min | Q1 Avg Min | Q4 Avg Max | Q1 Avg Max | % Change, Min | % Change, Max |
| Marketing Manager | $74,781 | $71,476 | $91,256 | $87,739 | -4.4% | -3.9% |
| Marketing Coordinator | $50,338 | $49,085 | $59,966 | $59,232 | -2.5% | -1.2% |
| Marketing Specialist | $52,381 | $51,695 | $65,308 | $60,605 | -1.3% | -7.2% |
| Digital Marketing Specialist | $58,495 | $58,994 | $75,108 | $72,194 | 0.9% | -3.9% |
| Digital Marketing Manager | $84,709 | $78,874 | $98,827 | $99,366 | -6.9% | 0.5% |
| Director of Marketing | $84,505 | $86,363 | $110,400 | $104,396 | 2.2% | -5.4% |
| Marketing Director | $83,000 | $80,010 | $108,917 | $98,646 | -3.6% | -9.4% |
| Marketing Assistant | $42,320 | $42,167 | $57,540 | $50,231 | -0.4% | -12.7% |
| Social Media and Marketing Manager | $50,778 | $46,445 | $66,202 | $66,395 | -8.5% | 0.3% |
| Social Media Manager | $56,500 | $63,727 | $64,846 | $81,413 | 12.8% | 25.5% |